
01
Renewable Energy
CBG, electricity and heat from organic waste
Convert sugar press mud, distillery effluent, crop residues and food waste into low-carbon fuel.
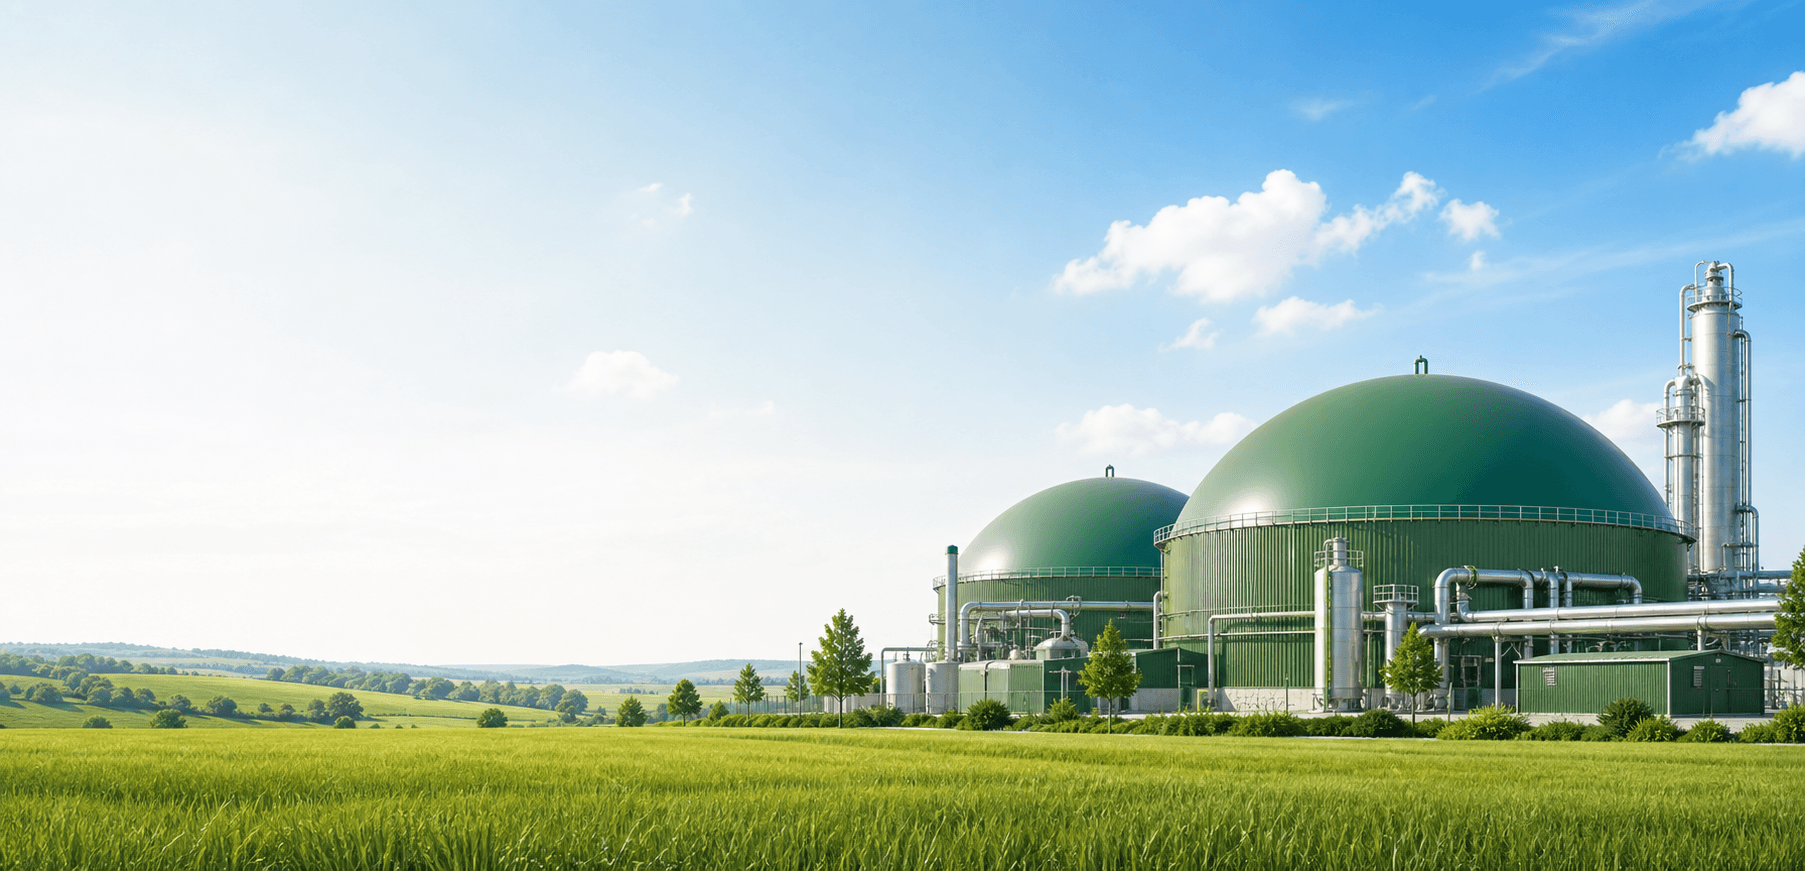 Turnkey EPC + O&M
3-12 TPD
Plant range
95%+
CBG purity
360°
Execution
Turn organic waste into fuel, fertilizer, and dependable project value with one execution partner.Green Vikalp delivers turnkey CBG and biogas plants that convert agricultural, industrial and municipal organic waste into clean fuel, premium fertilizer and predictable operational returns.
3 TPD
₹22 Cr
Sugar mills & farm-based CBG systems
6 TPD
₹36 Cr
Distillery and food hub capacity
12 TPD
₹64 Cr
Large industrial and municipal installations
₹105/kg₹75/kg
Revised CBG sale price
₹40/kg
Illustrative CBG profit
95%+
CBG purity after upgradation
CBG, electricity and heat from organic waste
Convert sugar press mud, distillery effluent, crop residues and food waste into low-carbon fuel.
Lender-ready support from planning to sanction
We support financial modelling, appraisal, lender presentations, and term-loan documentation for 70-75% project funding with no or minimal collateral and up to two years' interest-only moratorium.
State support may apply
Active state policies can provide capital, tax, duty, stamp, land, or infrastructure support, subject to location and approval.
Circular waste-to-energy value chain
Reduce methane emissions, lower fossil fuel imports and create nutrient-rich organic manure.
End-to-end project partner
We design, build, and operate advanced anaerobic digestion plants — and back every project with written commercial guarantees, so your investment rests on commitments, not promises.
Delivery guarantees
08
Five-year feedstock tie-ups and logistics planning keep the digester supplied and stable.
Assured purchase of 100% of the CBG you produce, through tie-ups with fuel marketers and industrial buyers.
Long-term CBG sale agreements of 10-15 years give your project durable revenue visibility.
Green Vikalp owns commissioning, biology management, and O&M for the first year of plant operation.
We buy back digestate as raw FOM at ₹2/kg and raw LFOM at ₹0.20/kg — byproduct revenue from day one.
Financial modelling, project appraisal, lender presentations, and term-loan documentation for 70-75% project funding.
We compile DPRs, technical drawings, and subsidy paperwork so your application moves fast.
Statutory approvals cleared on your behalf, with GOBARdhan and state subsidy applications managed end to end.
Bank loan
70-75%
of project cost, with no collateral or only minimal collateral
Interest rate
10.5% → 8-9%
indicative rate, typically reducing once subsidy-linked interest support applies
Moratorium period
Up to 2 years
interest-only payments during the moratorium — principal repayment begins after
Green-energy tax holiday: CBG projects can avail a 10-year income-tax holiday — no income tax is charged on project income during the holiday period, subject to eligibility and prevailing tax law.
Performance Snapshot
Unit economics, byproduct value, and illustrative annual profit for 3, 6 and 12 TPD plants at 350 operating days and 100% capacity utilisation.
CBG selling price revised upward from ₹75/kg to ₹105/kg — a 40% increase in modelled realisation. All project economics on this page reflect the revised price.
CBG unit economics
₹105 − ₹30 − ₹20 − ₹15
= ₹40 profit per kg of CBG
| Particular | ₹/kg |
|---|---|
| CBG Selling Price | ₹105 |
| Bank / Finance Cost | ₹30 |
| Running Expenses | ₹20 |
| Contingency | ₹15 |
| Total Considered Cost | ₹65 |
| Illustrative CBG Profit | ₹40/kg |
Running expenses cover electricity, water, labour, logistics and other routine operating expenses. The ₹40/kg figure is the illustrative base CBG profit before byproduct revenue.
These modelled returns assume stable feedstock supply, modern CBG upgradation, and the cost structure stated alongside. Final project returns require a site-specific financial model.
Profit accounting note: the displayed project profit equals CBG profit plus raw FOM and raw LFOM revenue. No separate FOM/LFOM processing, packaging, transport or marketing costs are assumed.
₹40/kg
CBG Base Profit
₹105 − ₹65 total considered cost
₹6.02 Cr
3 TPD Illustrative Annual Profit
on ₹12.85 Cr total annual revenue
₹12.04 Cr
6 TPD Illustrative Annual Profit
on ₹25.69 Cr total annual revenue
₹24.08 Cr
12 TPD Illustrative Annual Profit
on ₹51.38 Cr total annual revenue
Plant economics comparison
Swipe horizontally to compare capacities
| Metric | 3 TPD | 6 TPD | 12 TPD |
|---|---|---|---|
| CBG Production / Day | 3,000 kg | 6,000 kg | 12,000 kg |
| Approx. Feedstock / Day | 100 tonnes | 200 tonnes | 400 tonnes |
| Operating Days | 350 | 350 | 350 |
| Utilisation | 100% | 100% | 100% |
| CBG Revenue | ₹11.03 Cr | ₹22.05 Cr | ₹44.10 Cr |
| raw FOM Revenue | ₹1.40 Cr | ₹2.80 Cr | ₹5.60 Cr |
| raw LFOM Revenue | ₹0.42 Cr | ₹0.84 Cr | ₹1.68 Cr |
| Total Annual Revenue | ₹12.85 Cr | ₹25.69 Cr | ₹51.38 Cr |
| Illustrative Annual Profit | ₹6.02 Cr | ₹12.04 Cr | ₹24.08 Cr |
Figures shown are illustrative project-level estimates based on the stated assumptions, including 350 operating days, 100% capacity utilisation, ₹105/kg CBG selling price and assumed raw FOM/LFOM realisation. Actual project economics may vary depending on feedstock, financing structure, plant performance, operating costs, offtake terms, logistics, local conditions and byproduct realisation.
Byproduct value
A CBG plant also generates digestate in the form of raw FOM and raw LFOM. When appropriately monetised, these byproducts can contribute an additional revenue stream alongside gas sales.
3 TPD mass balance example
100 tonnes/day
Feedstock consumption
3 TPD
CBG output
20 tonnes/day
raw FOM output
60 tonnes/day
raw LFOM output
Byproduct outputs scale proportionately with feedstock: 6 TPD uses about 200 tonnes/day of feedstock (40 tonnes/day raw FOM, 120 tonnes/day raw LFOM) and 12 TPD about 400 tonnes/day of feedstock (80 tonnes/day raw FOM, 240 tonnes/day raw LFOM).
Daily byproduct value · 3 TPD example
raw FOM
20,000 kg × ₹2/kg
₹40,000/day
raw LFOM
60,000 kg × ₹0.20/kg
₹12,000/day
Total Byproduct Value
₹52,000/day
≈ ₹1.82 Cr/year at 350 operating days
Values describe raw FOM and raw LFOM as generated at the plant — not processed, enriched, branded, upgraded, pelletized or retail fertilizer economics.
Built by Green Vikalp
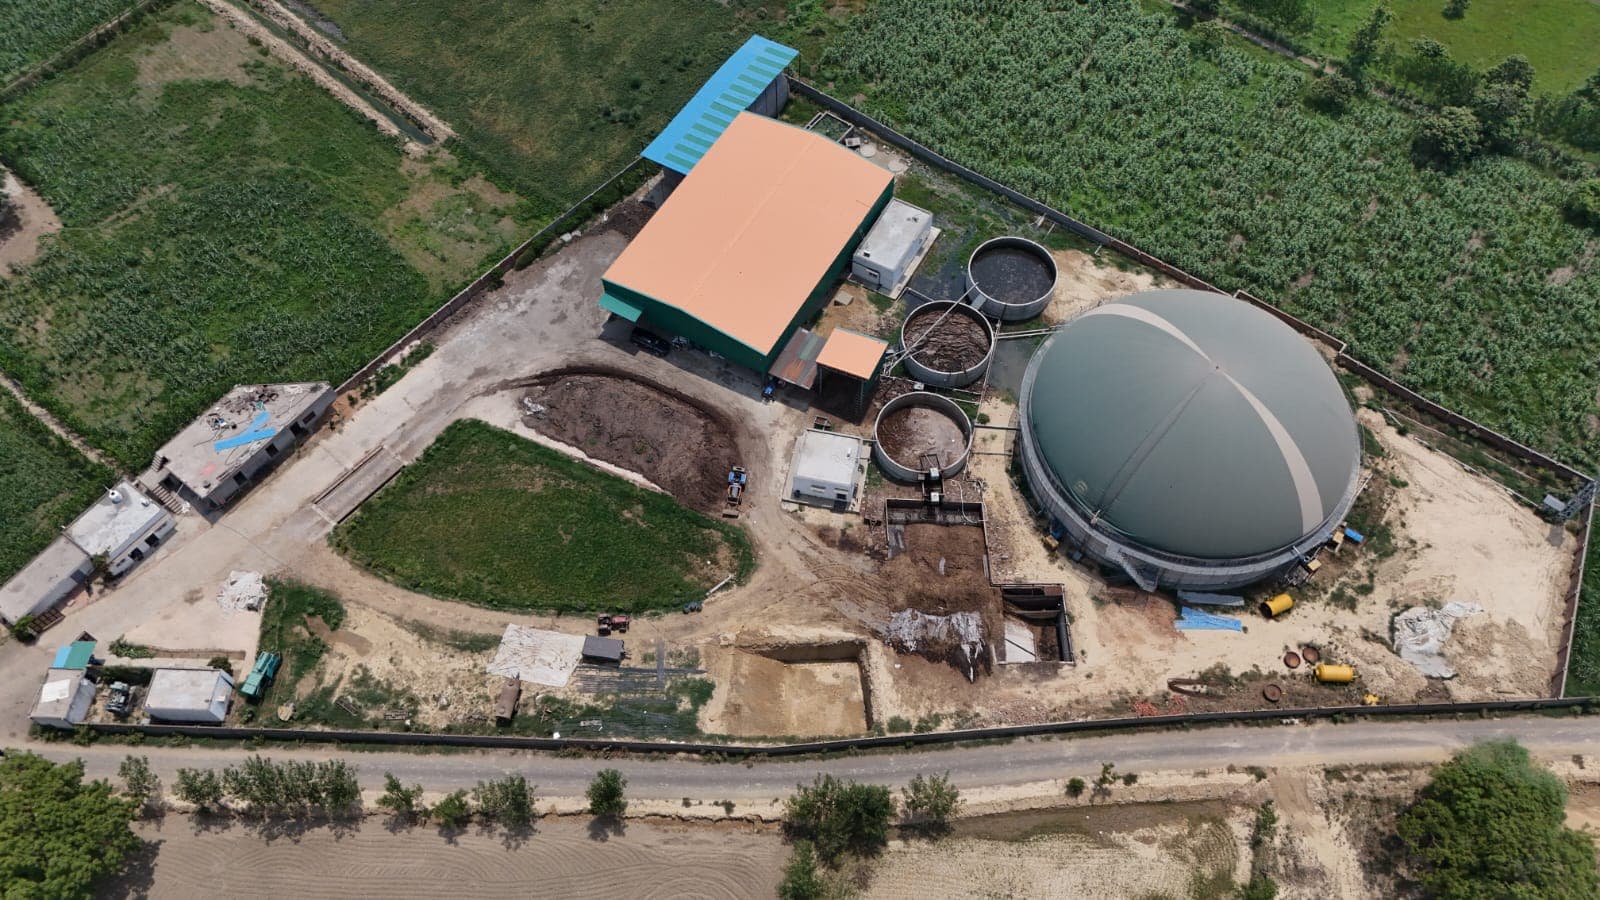
See the commissioned 3 TPD facility in Bulandshahr, from the feedstock and process areas to the main anaerobic digester and supporting infrastructure.
3 TPD
Installed capacity
Anaerobic
Digestion process
Bio-CNG
Primary output
Organic manure
Circular by-product
Raw material requirement (tonnes of feedstock per day)
Swipe horizontally to compare feedstocks
| Capacity | Napier Grass | Maize Silage | Press Mud | Cow Dung | Poultry Litter | Food Waste |
|---|---|---|---|---|---|---|
| 3 TPD | 45-50 tonnes | 32-40 tonnes | 70-80 tonnes | 120-150 tonnes | 55-65 tonnes | 22-28 tonnes |
| 6 TPD | 75-85 tonnes | 55-65 tonnes | 120-135 tonnes | 200-250 tonnes | 90-105 tonnes | 35-45 tonnes |
| 12 TPD | 180-205 tonnes | 130-155 tonnes | 290-320 tonnes | 480-600 tonnes | 215-255 tonnes | 85-110 tonnes |
All values are tonnes of feedstock required per day to sustain the listed CBG output capacity. Final feedstock mix depends on availability, moisture, and blending strategy.
Central and State Incentives
Explore the GOBARdhan national CBG framework alongside active state policies. Support varies by location, feedstock, project size, investment category, and approval status.
Central Government Assistance
Approved by the Union Cabinet on 6 August 2026 with a total outlay of ₹23,731 crore, GOBARdhan runs from FY 2026-27 to FY 2035-36 under the Ministry of Petroleum and Natural Gas. It unifies earlier CBG support — including MNRE’s CFA under the National Bioenergy Programme — into one national framework targeting nearly ten-fold growth in domestic CBG production.
3 TPD
Installed capacity
6 TPD
Installed capacity
12 TPD
Installed capacity
Capital assistance rate: up to ₹2 crore per TPD of installed CBG capacity. Eligible greenfield projects and brownfield capacity expansions; support extends beyond core plant machinery to feedstock aggregation, organic manure processing, and value-addition assets.
Six growth engines under GOBARdhan
Assured CBG offtake
City Gas Distribution procurement under the CBG Obligation: 3% in FY 2026-27, 4% in FY 2027-28, and 5% from FY 2028-29 in CNG (transport) and PNG (domestic).
Stable pricing framework
Administered CBG price of ₹2,110 per MMBTU with a minimum ten-year horizon, supported by a government-backed pricing framework.
Capital assistance
Up to ₹2 crore per TPD of installed CBG capacity for eligible greenfield projects, with brownfield capacity expansions also eligible.
Pipeline infrastructure
Cluster-based and standalone pipelines connecting CBG plants to trunk pipelines and CGD networks to reduce evacuation costs.
Credit guarantee support
A dedicated credit-guarantee mechanism to expand institutional lending to eligible MSME-based CBG projects.
CBG Ecosystem Challenge Fund
District-level support for feedstock mapping, aggregation infrastructure, technology adoption, and organic-manure value addition.
GOBARdhan assistance is not deducted from the illustrative revenue and profit figures shown above. Final assistance depends on scheme guidelines, eligibility, installed capacity, technical inspection, commissioning, budget availability, and approval by the Ministry of Petroleum and Natural Gas.
Additional state support
Active to October 2027
State Bio-Energy Policy 2022
₹75 lakh per tonne
CBG capacity subsidy capped at ₹20 Cr per unit, plus eligible stamp-duty, electricity-duty, development-charge, and land support.
Stage-1 applications to March 2027
Biofuels Production Promotion Policy 2023, amended 2025
15% of plant & machinery
Capital subsidy capped at ₹5 Cr, with potentially eligible interest, net-SGST, electricity-duty, stamp-duty, and employment support.
Active to April 2030
Biofuel Projects Scheme under RE Policy 2025
30–40% investment assistance
Formula-based assistance on eligible fixed capital investment, capped at ₹200 Cr and paid in seven annual instalments across seven years; infrastructure support can reach ₹5 Cr.
RIPS active to March 2029
Circular Economy Incentive Scheme 2025 with RIPS 2024
13–28% of eligible investment
Conditional capital subsidy paid over ten years, or alternative state-tax support, with electricity-duty, stamp-duty, land-conversion, and market-fee benefits.
Incentives are policy summaries, not an entitlement or financing commitment. Final eligibility, eligible investment, benefit amount, stacking restrictions, application windows, and disbursement depend on the competent authority and project-specific approval.
Our proprietary process ensures zero waste and maximum ROI
Food, agricultural & municipal waste collection
Proprietary bacterial decomposition
Clean fuel for transport and industrial power
Returning nutrients to the soil for agriculture
Our unique technology
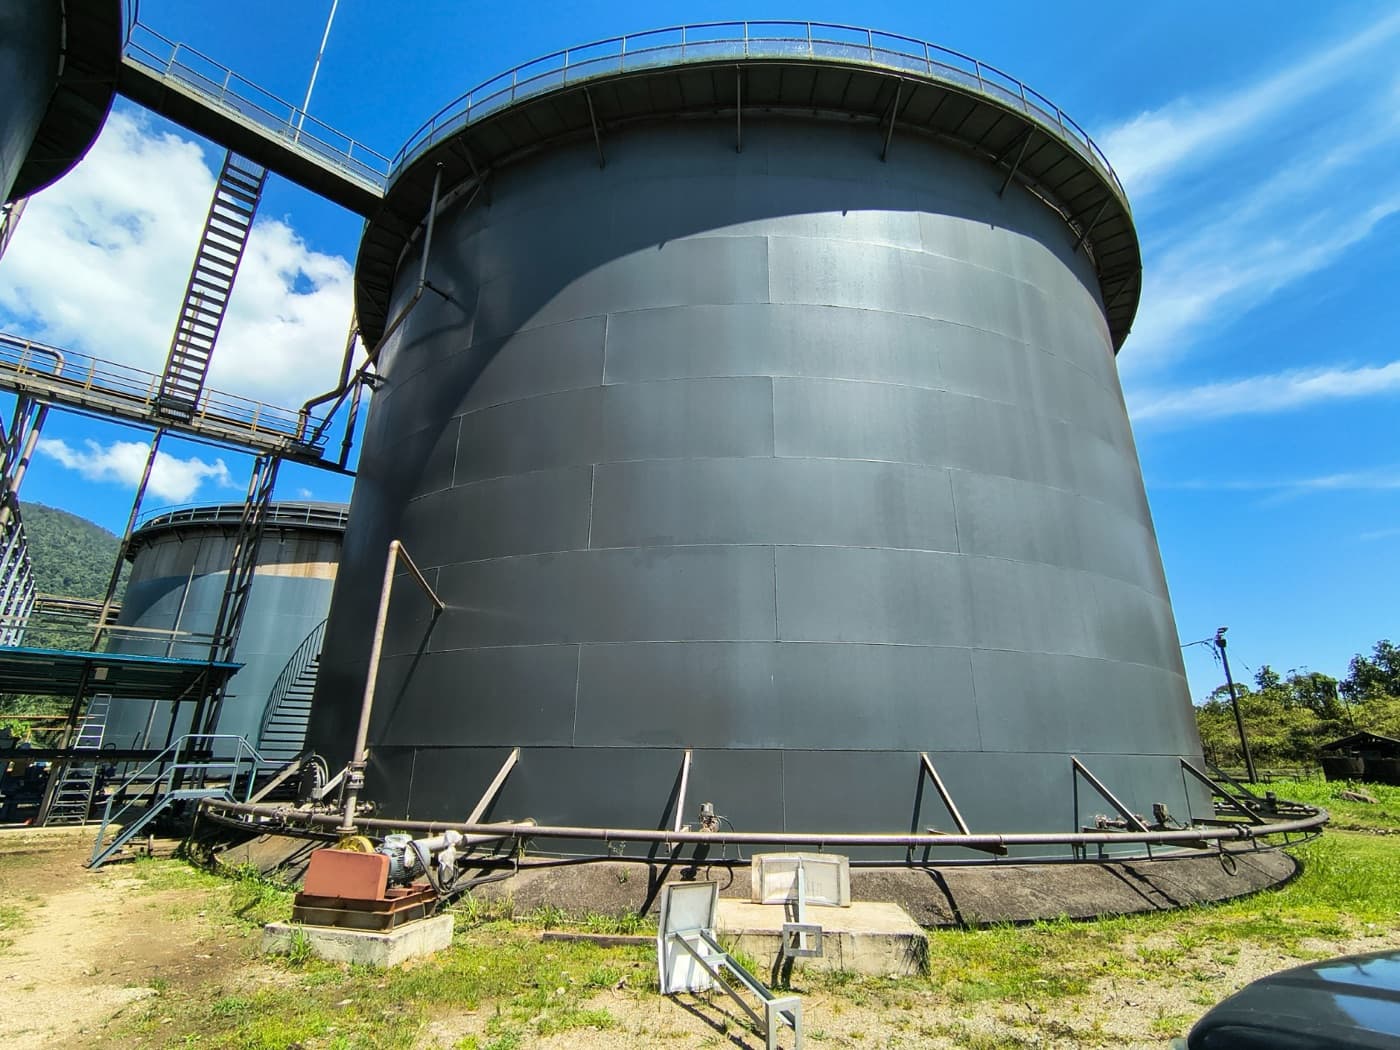
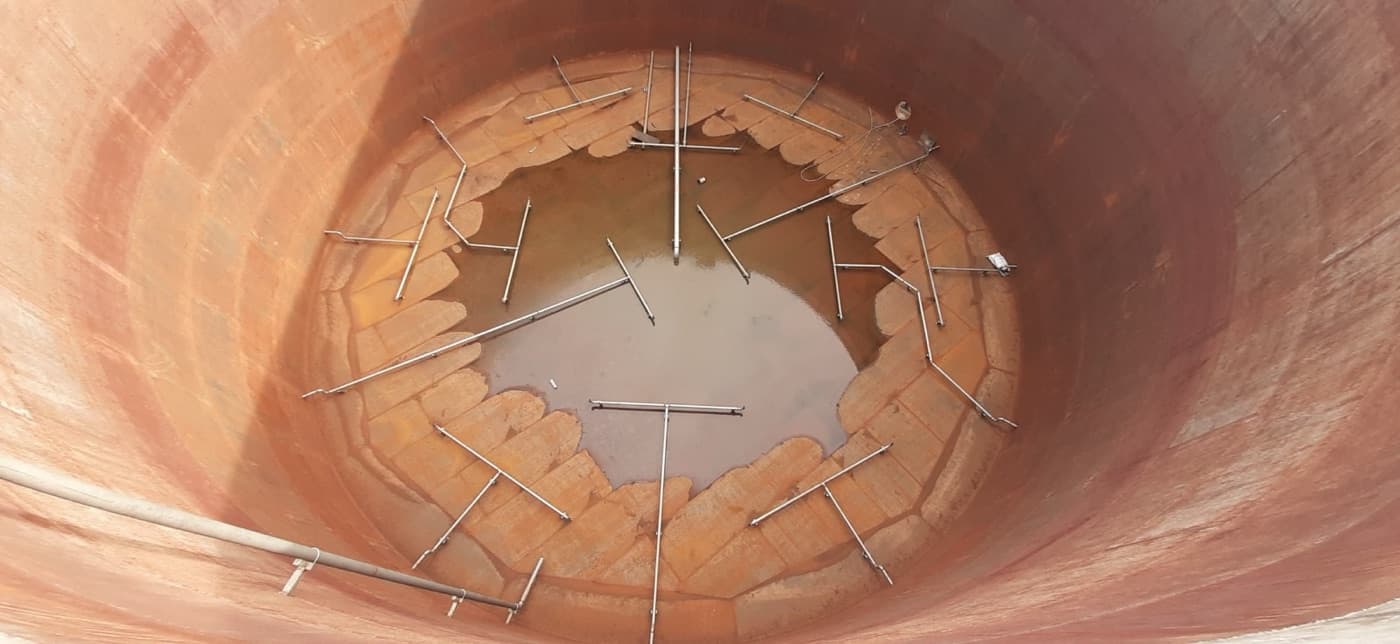
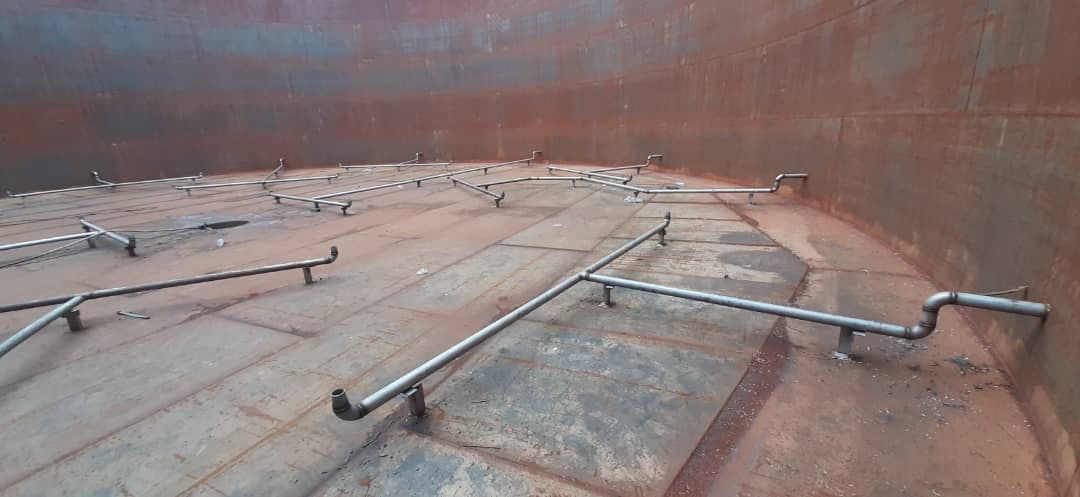
The system recirculates biogas from the dome and injects it through independently controlled zones. This creates three-dimensional sludge movement without placing rotating equipment inside the digester.
01
A blower draws biogas from the digester dome instead of introducing another process medium.
02
PLC-controlled solenoid valves pulse gas through individual injection zones at defined intervals.
03
Rising bubbles move sludge vertically while shifting injection points create horizontal circulation.
04
The cycle supports uniform heat, better substrate contact, and fewer floating or settled layers.
Why it matters
Conventional pumps and submerged propellers can face corrosion, struvite build-up, and shaft stress. Gas injection moves the process mass with fewer wear points inside the vessel.
Evaluate it for your plantThe injection network avoids mechanical mixers operating directly in abrasive sludge.
Sequenced mixing distributes heat and microorganisms across the digester volume.
Gas-injection studies cited in the technical presentation report energy savings of up to 50%.
The approach is suited to fibrous and high-solids agro-industrial substrates where crust control matters.
Performance depends on digester geometry, sludge characteristics, solids content, operating cycle, and equipment sizing. The cited energy-saving figure comes from the supplied technical presentation and should be validated during project engineering.
Feedstock performance guide
Compare common organic inputs by use case, raw-biogas potential, and expected CBG output, then model your selected feedstock below.
High-energy perennial crop suited to reliable, planned feedstock supply.
Biogas yield
180-220 m³/ton
CBG yield
55-70 kg/ton
Energy-dense ensiled crop with strong methane potential and consistent digestion.
Biogas yield
220-300 m³/ton
CBG yield
75-95 kg/ton
Sugar-industry filter residue suitable for seasonal or blended CBG production.
Biogas yield
90-120 m³/ton
CBG yield
35-45 kg/ton
Stable animal-waste base feedstock that supports biological consistency.
Biogas yield
50-70 m³/ton
CBG yield
18-25 kg/ton
Nutrient-dense poultry waste with valuable digestate and manure potential.
Biogas yield
120-180 m³/ton
CBG yield
45-60 kg/ton
High-yield municipal and industrial organics for optimized gas conversion.
Biogas yield
250-450 m³/ton
CBG yield
90-120 kg/ton
High-strength liquid effluent engineered according to its COD loading.
Biogas yield
Based on COD
CBG yield
Based on COD
Indicative ranges vary with moisture, volatile solids, organic loading, retention time, pre-treatment, and methane recovery. Final sizing requires laboratory and feedstock analysis.
Free project planning tools
Explore common biogas and CBG project scenarios with editable assumptions and instant results. No sign-up required.
Waste & output
Estimate waste managed, daily CBG output, annual fuel value, and potential disposal savings by feedstock.
Calculate nowReturns
Model annual EBITDA, simple ROI, payback, margin, and five-year operating surplus from your assumptions.
Calculate nowFinance
Estimate project debt, promoter equity, monthly EMI, annual debt service, interest, and indicative DSCR.
Calculate nowTechnological precision across the entire value chain.
Interactive feasibility model
Select your primary feedstock and daily availability to estimate a practical production range rather than a single generic output.
Indicative plant fit
3 TPD class
Selected yield basis
Raw biogas
90-120 m³/ton
CBG recovery
35-45 kg/ton
Estimated CBG production
3.5-4.5 T
per operating day
Based on 100 TPD of press mud.
9,000-12,000 m³
Raw biogas / day
1225-1575 tonnes
CBG / year
₹12.9-16.5 Cr
Gross annual CBG value
20 tonnes
raw FOM / day
60 tonnes
raw LFOM / day
₹52,000
raw FOM + raw LFOM value / day
Annual value assumes 350 operating days and the revised ₹105/kg CBG price (earlier model: ₹75/kg). raw FOM and raw LFOM estimates assume 20% and 60% of feedstock mass at ₹2/kg and ₹0.2/kg realisation. Outputs are indicative ranges; feedstock testing, moisture, volatile solids, retention time, methane recovery, and purification losses determine final performance.
Large-scale Compressed Bio-Gas (CBG) plants engineered for maximum methane yield and grid-grade purity.
Feasibility studies and feedstock analysis to assess plant viability.
Upgrading legacy biogas plants with modern membrane purification technology.
We don't just build; we operate. Our 24/7 monitoring and maintenance teams ensure 98% plant uptime and consistent revenue streams.
Remote Monitoring
Uptime Promise
Delivery portfolio
1
Delivered
8
Pipeline
36 TPD
Planned
 Commissioned
Flagship delivery · Bulandshahr, UP
A fully commissioned 3 TPD CBG facility converting agricultural residue, cattle dung, and food waste into transport-grade renewable gas and organic manure.
3 TPD
Plant capacity
Turnkey
EPC delivery
CBG
Fuel output
O&M
Operations support
Regional rollout
Uttar Pradesh
6 TPD
Press mud + crop residue
Uttar Pradesh
6 TPD
Agriculture + dairy waste
Uttar Pradesh
6 TPD
Dung + farm residue
Karnataka
6 TPD
Regional crop residue
Uttar Pradesh
3 TPD
Press mud + cattle dung
Uttar Pradesh
3 TPD
Dairy + farm waste
Uttar Pradesh
3 TPD
Food + biomass waste
Uttar Pradesh
3 TPD
Food + peri-urban waste
Our organic manure output is calibrated for long-term soil health, steady nutrient release and reduced reliance on synthetic chemicals.
Thermophilic digestion ensures safe, stable fertilizer.
Balanced NPK and organic matter for sustained crop growth.
Refined slurry treatment minimizing operational nuisances.
Improves moisture retention and soil biology over time.

Execution roadmap
A structured, high-precision path from waste audit to energy generation — with clear deliverables at every phase.
Typical timeline
6-9 months
Months 1-2
01Comprehensive waste audit, feedstock analysis, and topographical survey of the proposed site.
Months 2-4
02Customized plant blueprinting using 3D modeling and structural engineering for durability.
Months 4-6
03Precision execution of civil work and installation of proprietary biogas reactors.
Months 6-9
04Performance testing, operator training, and the first year of operations responsibility, with lifelong after-sales support.
Typical duration from site assessment to commissioning is 6-9 months. The final schedule depends on plant capacity, site readiness, statutory approvals, and equipment delivery.
CBG project knowledge base
Practical guidance on plant fit, commercial returns, organic manure, and turnkey EPC delivery.
19
Practical answers
03
Focused topics
Topic 01
Start with feedstock, plant fit, timelines, incentives, and day-to-day operation.
A biogas plant converts organic waste into methane-rich gas through anaerobic digestion. Green Vikalp designs plants that process food, agricultural, and industrial waste, then recover energy, fertilizer, and process water from the same system.
Common feedstocks include cattle dung, agricultural residues, food waste, distillery spent wash, and press mud. These materials can be blended to support stable digestion and improve methane yield.
Yes. Purification and compression systems can upgrade raw biogas into high-purity CBG for transport fuel, industrial burners, or other gas-quality energy applications.
A typical project takes 6 to 9 months from site assessment through commissioning. The final schedule depends on plant capacity, site readiness, statutory approvals, civil work, and equipment delivery.
Central support for CBG now flows through GOBARdhan, India's National Unified Scheme for Compressed Biogas, approved by the Union Cabinet on 6 August 2026 with a ₹23,731 crore outlay for FY 2026-27 to FY 2035-36. It provides capital assistance of up to ₹2 crore per TPD of installed CBG capacity, an administered CBG price of ₹2,110 per MMBTU with a minimum ten-year horizon, and assured offtake through the CBG blending obligation. State bio-energy policies may add location-specific support. Green Vikalp helps prepare eligibility documents and align the project scope with the applicable framework.
Routine work includes monitoring digester biology, checking pumps and valves, cleaning filters, calibrating gas-upgrading equipment, and completing preventive maintenance. Consistent O&M reduces downtime and protects gas output.
Fertilizer output depends on feedstock volume, composition, and the selected digestate process. The recovered digestate can be refined for on-site use or sale, creating value alongside CBG production.
Suitability depends on the consistency of your waste supply, energy needs, available land, utilities, and project economics. Farms, food processors, distilleries, hotels, municipalities, and industrial sites with steady organic waste are common candidates.
Topic 02
Understand CBG offtake, manure products, profitability, and pre-investment decisions.
Green Vikalp can guide clients on industrial demand, applicable government-supported initiatives, gas-quality requirements, storage, and potential offtake strategies. Commercial arrangements vary by project, so each route is evaluated against the plant's location and output.
Yes. Digestate generates raw FOM (the solid fraction) and raw LFOM (the liquid fraction), which can be sold as generated at illustrative realisations of ₹2/kg for raw FOM and ₹0.20/kg for raw LFOM. For a 3 TPD plant this equates to roughly ₹52,000 per day of byproduct value. Further processing, packaging, or branding can add value, but those economics are project-specific.
raw FOM is the nutrient-rich solid fraction left after anaerobic digestion and digestate dewatering. It contains organic matter and nutrients that can improve soil health when processed and used in line with applicable quality requirements.
raw LFOM is the liquid fraction recovered from digestate. It contains dissolved nutrients and can be used as a bio-fertilizer where local agronomic practices and quality requirements permit.
Yes. The model CBG selling price used across this website has been revised upward from ₹75/kg to ₹105/kg. All annual revenue and illustrative annual profit figures — ₹6.02 Cr for 3 TPD, ₹12.04 Cr for 6 TPD, and ₹24.08 Cr for 12 TPD — reflect the revised price at 350 operating days and 100% capacity utilisation.
At the revised indicative CBG selling price of ₹105/kg, the base model considers ₹65/kg of total cost (₹30/kg bank or finance cost, ₹20/kg running expenses, and ₹15/kg contingency), leaving ₹40/kg of CBG profit: ₹105 − ₹30 − ₹20 − ₹15 = ₹40. For a 3 TPD plant operating 350 days a year at 100% utilisation, this implies an illustrative annual profit of about ₹6.02 Cr, including raw FOM and raw LFOM byproduct revenue. These are project-level estimates, not assured returns; actual profitability depends on feedstock security, plant capacity, gas yield, operating efficiency, capital cost, financing, and offtake, and requires a site-specific feasibility study.
Yes. Pre-investment consultancy covers feedstock availability, site conditions, expected gas output, utilities, capital and operating costs, market opportunities, implementation strategy, and key project risks.
Topic 03
See how the project is managed from customized engineering through final commissioning.
Yes. The project team coordinates engineering, procurement, construction, vendors, schedules, budgets, quality inspections, and commissioning. Clients retain one point of contact throughout the EPC lifecycle.
Yes. Equipment selection, digester sizing, utilities, automation, layouts, and expansion provisions are tailored to the feedstock, site, production target, and commercial priorities rather than copied from a standard plant design.
Typical deliverables include process flow diagrams, P&IDs, equipment datasheets, layouts, operating and maintenance manuals, inspection reports, commissioning records, calibration certificates, warranties, and as-built drawings.
Yes. Engineers support equipment checks, calibration, process start-up, biological stabilization, gas-quality verification, performance testing, and operator training until the plant meets the agreed commissioning parameters.
Join the ranks of carbon-neutral leaders. Get a technical and commercial feasibility study for your facility today.
Joined by 50+ industrial partners nationwide